


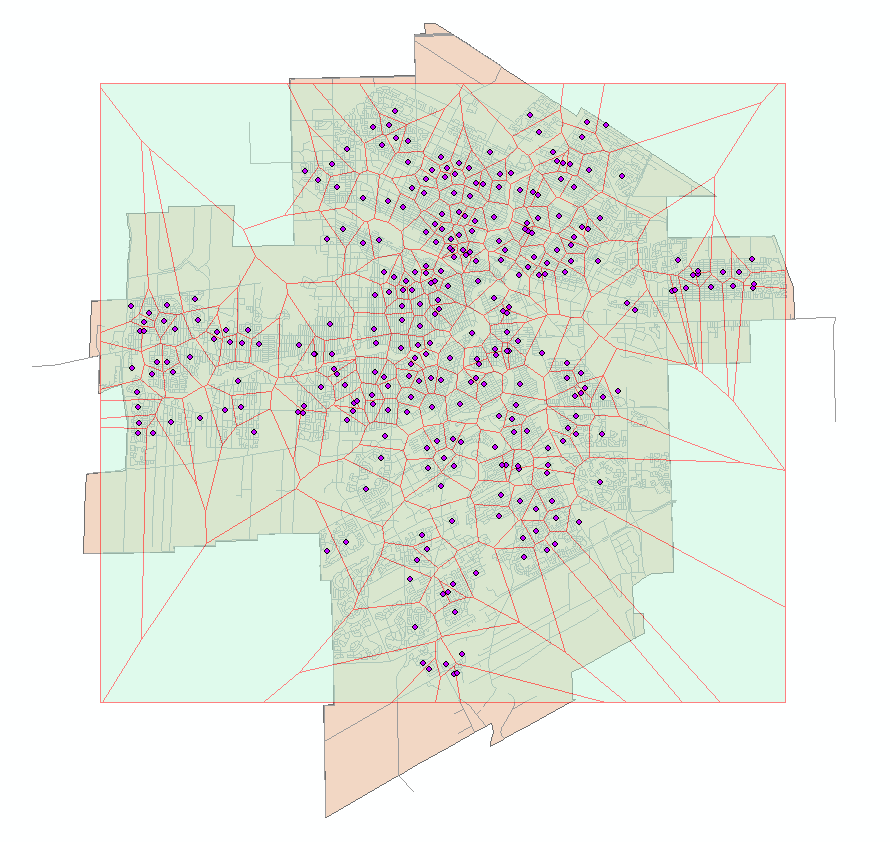
Which school is closest to any given address in Winnipeg? Learn the answer using Thiessen Polygons, a simple analysis tool in ArcMap 10.5. (Detail.)
Winter 2018 GIS Workshops
During Winter 2018, the UM Libraries are offering the following GIS workshops for U of M students, staff, and faculty.
A Geographic Information System (GIS) is a powerful tool used for digital mapping and spatial analysis. GIS software is used to visualize and analyze data across a range of topics, such as:
- Political data: city boundaries, countries and provinces, voting districts
- Environmental data: tree locations and species, wildlife ranges, flooded areas, precipitation levels
- Sociological data: locations of burglaries, bicycle thefts, population demographics
- And much more.
A GIS is often used to facilitate informed decision making.
Reserve your spot using the links below!
Introduction to GIS using ArcGIS Desktop
This workshop is ideal for users who have no background in GIS, and are curious to learn a bit about what we can do with this software. We will explore some options for data sources, and learn some fundamental GIS operations using ArcGIS Desktop 10.5. This workshop is designed to get you started and excited about using GIS. (See feature illustration above.)
For all UM students/staff/faculty: Jan 15, 12 to 1:30 p.m. Register here: https://lib-umanitoba.libcal.com/event/3436460
For graduate students only: Jan 16, 12 to 1:30 p.m. Register here: https://manitobagrad.hobsonsradius.com/ssc/eform/x78828N7708Ex6700kN70IF.ssc
Note: This introductory workshop is a recommended prerequisite to the workshop “Visualize Data Using ArcGIS Desktop 10.5.”
Map Using MS Excel’s Plug-in
 Without knowing a thing about GIS, you can use the ArcGIS Maps for Office plug-in to map data in your spreadsheet in a style that shows either proximities, spatial extents, or hotspots with degrees of significance. You can select a map style to tell a story. The maps can be inserted into a PowerPoint, or shared.
For all UM students/staff/faculty: Jan 29, 12 to 1:30 p.m. Register here: https://lib-umanitoba.libcal.com/event/3436461
For graduate students only: Jan 30, 12 to 1:30 p.m. Register here: https://manitobagrad.hobsonsradius.com/ssc/eform/Gd670cB87S3Ex6700tBal.ssc
Map (right) is made with ArcGIS Maps for Office in MS Excel and uses Hot Spot Analysis to determine the movement patterns of Wapiti in New Zealand. Click on illustration to enlarge.
Visualize Data Using ArcGIS Desktop 10.5
 Learn how to use a variety of tools that will help you manage both spreadsheet data and the map you create. The template, basic analysis and projection tools introduced in this workshop will help you create a map and symbolize the data by feature, category, quantity, chart, or using multiple attributes. Tools used to prepare your map for publication will also be covered.
If you have not used ArcGIS Desktop before, the workshop “Introduction to GIS Using ArcGIS Desktop” is highly recommended.
For all UM students/staff/faculty: Feb 12, 12 to 1:30 p.m. Register here: https://lib-umanitoba.libcal.com/event/3436462
For graduate students only: Feb 13, 12 to 1:30 p.m. Register here: https://manitobagrad.hobsonsradius.com/ssc/eform/Mc0k72KG003m0x671wB71.ssc
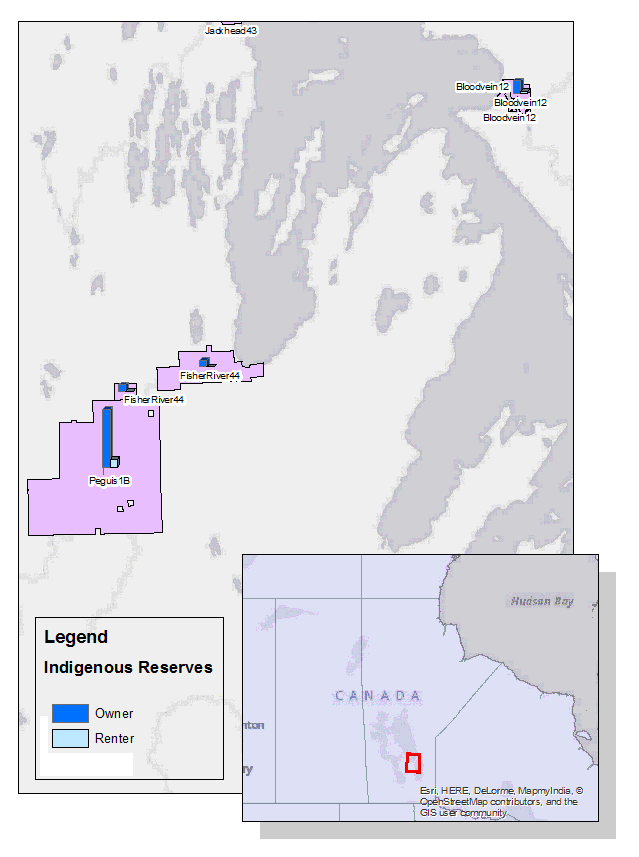
ArcMap 10.5 provides a range of options for data visualization. Symbolize by categories, quantities, or using charts, as in the example shown. Click on illustration to enlarge.
Did you know that the UM Libraries offer workshops that cover a range of topics to help you reach your academic goals? Check out all Library & Archives workshops and events using this calendar.