5 things to watch for in the latest IPCC report on climate science
On Aug. 9, the Intergovernmental Panel on Climate Change (IPCC) will release its most comprehensive report on the science of climate change since 2013. It will be the first of four reports released under the IPCC’s latest assessment cycle, with subsequent reports coming in 2022.
Over the past eight years, climate scientists have improved the methods they use to measure different aspects of climate and to model (or project) what might happen in the future. They’ve also been monitoring the changes that have developed right before our eyes.
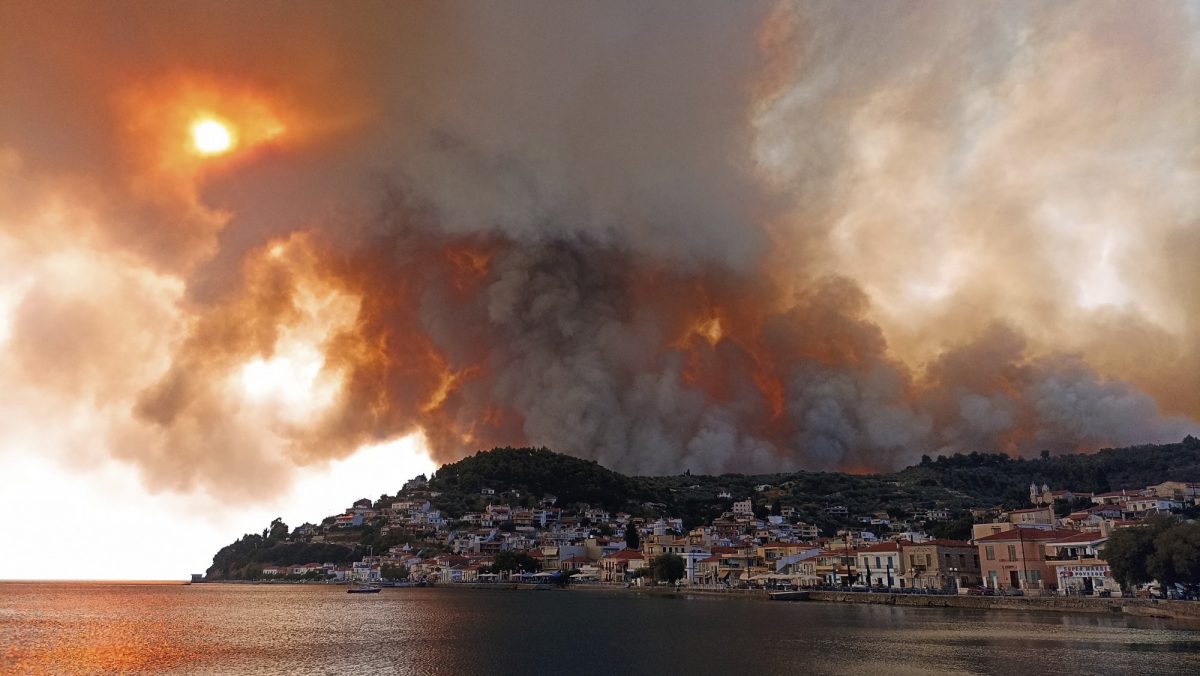
This updated assessment comes three months before world leaders gather in Glasgow, Scotland, to find ways to avoid the worst effects of climate change and renew their commitments to reduce greenhouse gases. It also comes amid another year of severe heat waves, droughts, wildfires, flooding and storms.
The report will provide policy-makers with the best possible information regarding the physical science of climate change, which is essential for long-term planning in many sectors, from infrastructure to energy to social welfare. Here are five things to look for in the new report:
1. How sensitive is the climate to increasing carbon dioxide?
Atmospheric carbon dioxide (CO2) levels are higher now than they have been in 800,000 years, reaching 419 parts per million (ppm) in May 2021. Average global temperature rises with each increase in atmospheric CO2 concentration, but how much it rises depends on many factors.
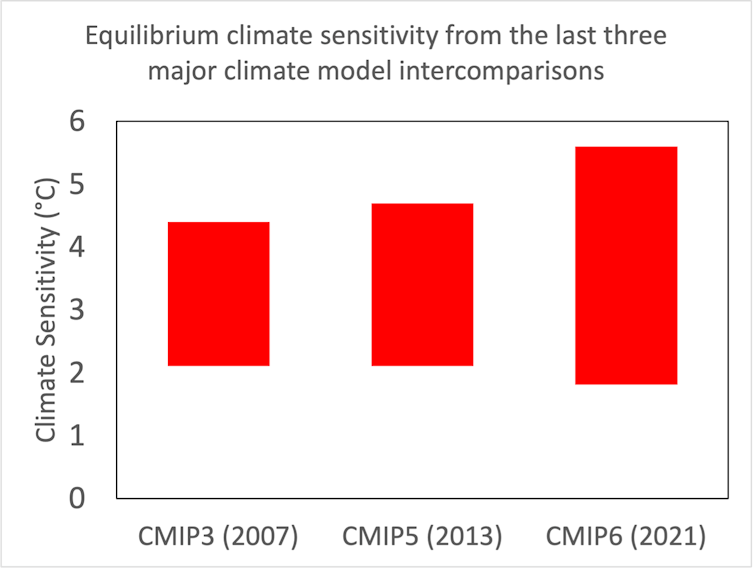
Climate scientists use models to understand how much warming occurs when CO2 concentrations double from pre-industrial levels — from 260 ppm to 520 ppm — a concept called “climate sensitivity.” The more sensitive the climate, the faster greenhouse gas emissions must be curbed to stay below 2 C.

Equilibrium climate sensitivity from the last three major climate model intercomparisons. (Note: There was no ‘CMIP4’.) (Data: IPCC, Graph: Alex Crawford)
Older climate models estimated that a doubling of atmospheric CO2 would lead to a temperature increase of 2.1 C to 4.7 C. The latest set of climate models, called CMIP6, broadened the range to 1.8 C to 5.6 C, meaning the climate is at least as sensitive to doubling of carbon dioxide as previous models showed, but may, in fact, be even more sensitive.
The range is influenced by uncertainties in a number of climate factors, including water vapour and cloud cover, and how they will increase or decrease the effects of warming. Scientists are working to narrow the range in climate projections so that we know more about how quickly we must reduce greenhouse gas emissions to avoid the worst effects of climate change and adapt to others.
2. What’s going on with clouds?
Clouds are a wild card in the climate change game. They create feedbacks to warming, meaning that warming changes cloud cover, but cloud cover can also speed up or slow down warming in different situations.
Clouds reflect about a quarter of incoming sunlight away from the Earth. So, if more warming leads to more clouds, we would expect more sunlight to be reflected, slowing warming. However, clouds also insulate the Earth, trapping the heat given off by the surface. So, increasing cloud cover (like during nighttime) could amplify warming.

Cloud feedback properties depend in part on the type and altitude of the cloud. (Alex Crawford)
Two main issues stand out: First, many factors, including cloud type, altitude and season, determine a cloud’s overall effect on warming. Second, clouds are incredibly difficult to model; how the models treat clouds is key to the range in climate sensitivity.
3. Did climate change fuel recent extreme weather?
Since the last IPCC report, our ability to assess global warming’s impact on extreme events has improved immensely. Chapter 11 of the latest report is devoted to this.
Global warming means stronger summer heat waves and more frequent tropical nights (temperatures above 20 C) are occurring in middle latitudes, like Canada and Europe.
Read more:
Record-breaking temperatures mean we must change the way we talk about the climate emergency
Warmer air can hold more water. This can cause more evaporation from land, and lead to drought and wildfires. In addition, an atmosphere with more water can produce more precipitation and flooding.
Scientists projected decades ago that these changes to the water cycle would occur, but now it’s clear they’re already happening.
4. Have regional climate projections improved?

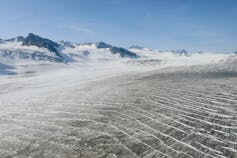
Shamrock Glacier, like many other glaciers in Alaska, has been thinning and retreating since the 1950s. (Alex Crawford), CC BY-SA
The climate models evaluated by the IPCC are global models. This is essential to capture the connections between tropics and poles or land and ocean. However, it comes at a cost — the models struggle to simulate many features smaller than 100 kilometres across, like small storms or islands.
Regional relationships can be complex: For example, extreme storms help break up summer Arctic sea ice, but reduced sea ice cover may also lead to stronger storms.
Read more:
5 ways climate-driven ocean change can threaten human health
Since the last IPCC report, techniques for taking this large-scale information and refining it have shown how regional and local climate has changed and could change in the future. Other experiments target regional issues, like the impacts of Arctic sea ice loss on storms.
5. How will Antarctic ice sheets contribute to sea-level rise?
Global sea level is rising because water expands slightly when it warms up, and mountain glaciers and the Greenland Ice Sheet are melting and adding water to the ocean.
But the largest potential source of sea-level rise over the next century is Antarctica. Ice sheet models show that melting of Antarctic ice sheets will add between 14 and 114 centimetres to sea-level rise by 2100. That is a huge range, and it all depends on whether the West Antarctic Ice Sheet remains relatively stable or begins a slow but unstoppable collapse.
Read more:
High-tide flood risk is accelerating, putting coastal economies at risk
How the IPCC communicates this scientific debate will impact how coastal communities plan for sea-level rise. Low-lying cities, like Lagos, Nigeria, could become uninhabitable by the end of the century due to sea-level rise, especially if the higher model estimates prove most prescient.

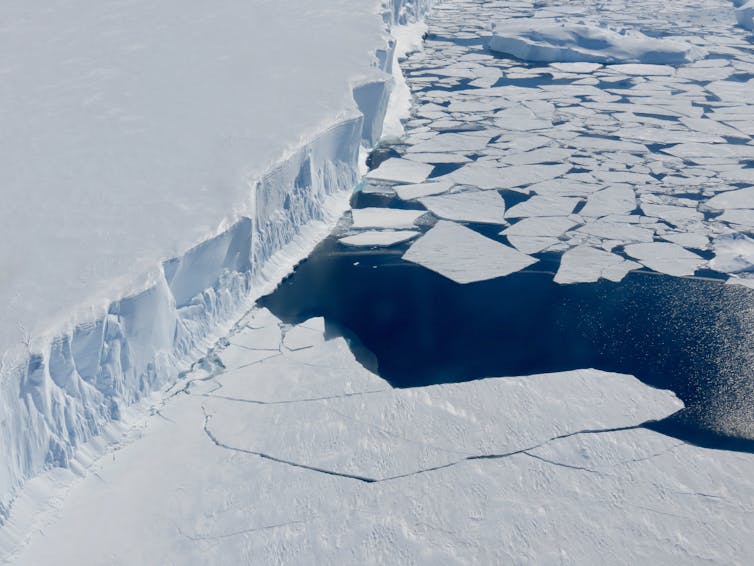
The fate of the West Antarctic Ice Sheet lies with the Thwaites Glacier. If the front of the Thwaites breaks up, it would expose an even larger body of ice to warm waters. (Karen Alley)
The IPCC report will give policy-makers a better understanding of how climate change is affecting us today. This will be especially helpful for putting short-term adaptation strategies in place.
But as the science has improved, the outlook on future change has become more sobering, and the large uncertainties that remain mean substantial future work for climate scientists.
Alex Crawford, Research Associate at the Centre for Earth Observation Science, Clayton H. Riddell Faculty of Environment, Earth, and Resources, University of Manitoba.
This article is republished from The Conversation under a Creative Commons license. Read the original article.
Research at the University of Manitoba is partially supported by funding from the Government of Canada Research Support Fund.


